
import matplotlib.pyplot as pyplot
# Create data
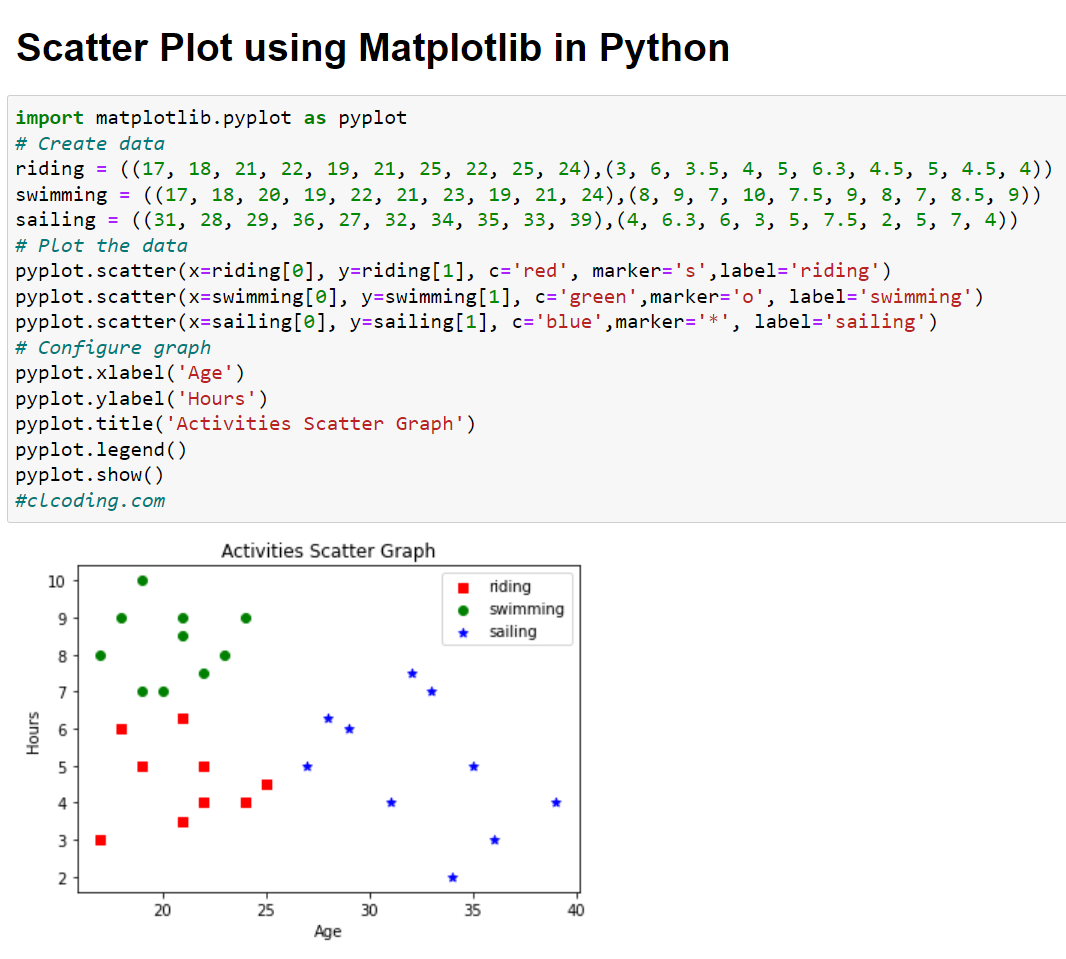
riding = ((17, 18, 21, 22, 19, 21, 25, 22, 25, 24),(3, 6, 3.5, 4, 5, 6.3, 4.5, 5, 4.5, 4))
swimming = ((17, 18, 20, 19, 22, 21, 23, 19, 21, 24),(8, 9, 7, 10, 7.5, 9, 8, 7, 8.5, 9))
sailing = ((31, 28, 29, 36, 27, 32, 34, 35, 33, 39),(4, 6.3, 6, 3, 5, 7.5, 2, 5, 7, 4))
# Plot the data
pyplot.scatter(x=riding[0], y=riding[1], c='red', marker='s',label='riding')
pyplot.scatter(x=swimming[0], y=swimming[1], c='green',marker='o', label='swimming')
pyplot.scatter(x=sailing[0], y=sailing[1], c='blue',marker='*', label='sailing')
# Configure graph
pyplot.xlabel('Age')
pyplot.ylabel('Hours')
pyplot.title('Activities Scatter Graph')
pyplot.legend()
pyplot.show()
#clcoding.com


.png)


0 Comments:
Post a Comment