Saturday 13 August 2022

Day 31 : Radar Plot using Python


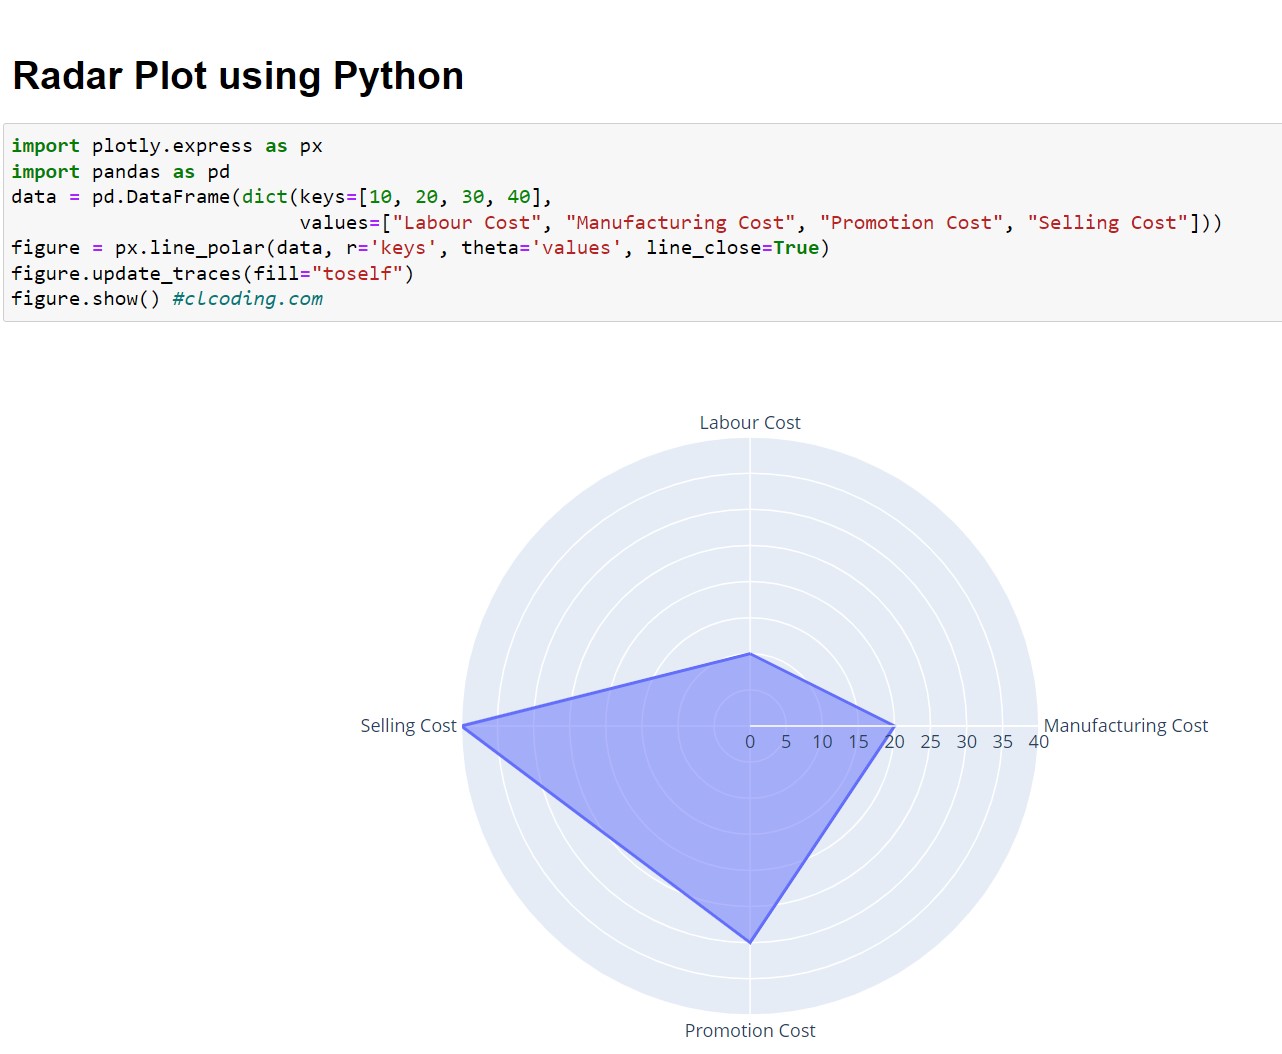
import plotly.express as px

import pandas as pd

data = pd.DataFrame(dict(keys=[10, 20, 30, 40], 

                         values=["Labour Cost", "Manufacturing Cost", "Promotion Cost", "Selling Cost"]))

figure = px.line_polar(data, r='keys', theta='values', line_close=True)

figure.update_traces(fill="toself")

figure.show() #clcoding.com


0 Comments:

Post a Comment

Popular Posts

Categories

AI (27) Android (24) AngularJS (1) Assembly Language (2) aws (17) Azure (7) BI (10) book (4) Books (114) C (77) C# (12) C++ (82) Course (60) Coursera (176) coursewra (1) Cybersecurity (22) data management (11) Data Science (89) Data Strucures (6) Deep Learning (9) Django (6) Downloads (3) edx (2) Engineering (14) Excel (13) Factorial (1) Finance (5) flutter (1) FPL (17) Google (19) Hadoop (3) HTML&CSS (46) IBM (25) IoT (1) IS (25) Java (92) Leet Code (4) Machine Learning (44) Meta (18) MICHIGAN (5) microsoft (3) Pandas (3) PHP (20) Projects (29) Python (745) Python Coding Challenge (197) Questions (2) R (70) React (6) Scripting (1) security (3) Selenium Webdriver (2) Software (17) SQL (40) UX Research (1) web application (8)

Followers

Person climbing a staircase. Learn Data Science from Scratch: online program with 21 courses