
Logistic Regression in Python: part-01
Welcome to python crash course, Today we are going to start Logistic Regression. basically, in this post you will learn How to encoding data so let's start:
As the amount of available data, the strength of computing power, and the number of algorithmic improvements continue to rise, so does the importance of data science and machine learning. Classification is among the most important area of machine learning, and logistic regression is one of its basic methods. By the end of this tutorial, you will have learned about classification in general and the fundamentals of logistic regression in particular, as well as how to implement logistic regressions in Python.
Supervised machine learning algorithms define models that capture relationships among data. Classification is an area of supervised machine learning that tries to predict which class or category some entity belongs to, based on its features.
For example, you might analyze the employees of some company and try to establish a dependence on the features or variables, such as the level of education, number of years in a current position, age, salary, odds for being promoted. The features or variable can take one of two forms:
- Independent variable, also called input or predictor, doesn’t depend on other features of interest (or at least you assume so for the purpose of the analysis).
- The dependent variable, also called output or responses, depending on the independent variables.
Encoding Data
In [01]: # creating one hot encoding of categorical column.data = pd.get_dummies(df, columns =['job', 'marital', 'default', 'housing', 'loan', 'poutcome'])
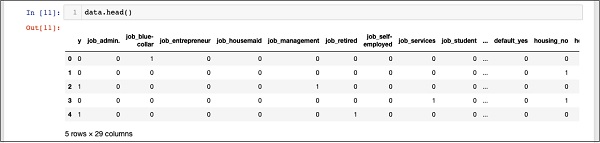
In [02]: data.head()
You will see the following outputs −
Dropping the “unknown”
In [03]: data.columns[12]Out[03]: 'job_unknown'
In [04]: data.drop(data.columns[[12, 16, 18, 22, 24]], axis=1, inplace=True)
After dropping the undesired columns, you can see the final list of columns as shown in the output below −
In [05]: data.columnsOut[16]: Index(['y', 'job_admin.', 'job_bluecollar', 'jobentrepreneur','jobhousemaid', 'job_management', 'job_retired', 'job_self-employed','jobservices', 'job_student', 'job_technician', 'job_unemployed','marital_divorced', 'marital_married', 'marital_single', 'default_no','default_yes', 'housingno', 'housing_yes', 'loan_no', 'loan_yes','poutcome_failure', 'poutcome_nonexistent', 'poutcomesuccess'],dtype='object')
our data is ready for model buildings.
In the next post, we will see how to split the data.
If you want to learn more about python then click here.
Best of Luck!!!!!!
Telegram: https://t.me/clcoding_python
https://www.facebook.com/pirawenpython/
https://www.facebook.com/groups/pirawenpython/


.png)


.png)


0 Comments:
Post a Comment