Showing posts sorted by relevance for query Data Analysis with Python. Sort by date Show all posts

Wednesday, 27 November 2024

Data Analysis with Python


Unlocking Data Insights: Data Analysis with Python on Coursera

In today’s data-driven world, the ability to analyze and interpret data has become one of the most valuable skills in any field. Whether you're looking to advance your career in data science, improve your business decision-making, or simply explore the world of data, learning how to use Python for data analysis is a powerful tool. If you want to gain a solid foundation in data analysis with Python, the Data Analysis with Python course on Coursera is the perfect place to start.

Why Should You Take This Course?

Python is widely recognized as one of the best programming languages for data analysis, thanks to its simplicity, versatility, and the vast array of libraries it offers, such as Pandas, Matplotlib, and NumPy. The Data Analysis with Python course on Coursera introduces you to the key tools and techniques necessary to extract meaningful insights from raw data using Python.

Why you should consider enrolling in this course:

Comprehensive Learning: The course covers the complete data analysis pipeline, from data cleaning and exploration to visualization and advanced analysis techniques.

Hands-On Approach: Learn through practical, real-world exercises that help you apply your learning directly to projects.

Expert-Led: The course is taught by experts from the IBM Data Science team, providing insights from the frontlines of data science and analysis.

Career Advancement: Python skills are in high demand, and this course can boost your career by providing you with the skills needed to perform data analysis efficiently.

Flexible Learning: As with all Coursera courses, you can learn at your own pace, making it perfect for students, professionals, or anyone with a busy schedule.


What you'll learn

  • Develop Python code for cleaning and preparing data for analysis - including handling missing values, formatting, normalizing, and binning data
  • Perform exploratory data analysis and apply analytical techniques to real-word datasets using libraries such as Pandas, Numpy and Scipy
  • Manipulate data using dataframes, summarize data, understand data distribution, perform correlation and create data pipelines
  • Build and evaluate regression models using machine learning scikit-learn library and use them for prediction and decision making


Introduction to Data Analysis with Python

Start by understanding the role of Python in data analysis and familiarize yourself with Python libraries like Pandas, NumPy, and Matplotlib.

Learn how Python can be used to handle and manipulate data, perform basic statistics, and create meaningful visualizations.

Data Cleaning and Preprocessing

In real-world data, the information you need is often messy. This section teaches you how to clean and prepare your data by handling missing values, duplicates, and errors.

You’ll learn how to reshape data and make it ready for analysis using Python’s powerful libraries.

Exploratory Data Analysis (EDA)

Understand the process of exploring data to find patterns, relationships, and insights.

Learn techniques for summarizing and visualizing data using statistical plots, histograms, scatter plots, and more.

Gain hands-on experience with Matplotlib and Seaborn for data visualization.

Data Analysis with Pandas

Dive deep into Pandas, one of the most widely-used libraries for data manipulation.

Learn how to load, inspect, and manipulate data using DataFrames and Series. Understand operations like sorting, grouping, filtering, and merging datasets.

Advanced Data Analysis Techniques

Learn more advanced topics like working with time-series data, handling categorical data, and using NumPy for mathematical computations.

Discover the power of SciPy and other Python libraries to conduct in-depth analysis on complex datasets.

Data Visualization and Reporting

Master data visualization techniques to communicate your findings effectively.

Learn how to create professional charts, graphs, and dashboards using Matplotlib and Seaborn.

Discover best practices for presenting your data to different audiences.

Capstone Project

The course concludes with a hands-on capstone project, where you’ll apply everything you’ve learned to analyze a real-world dataset and present your findings.

This project is designed to showcase your new skills and can be added to your portfolio for potential employers to see.

Benefits of Learning Data Analysis with Python

High Demand in the Job Market

Data analytics is one of the most sought-after skills today. By mastering Python, you’ll be able to work in industries ranging from healthcare and finance to technology and entertainment. Python's data analysis capabilities make it an essential skill for roles such as Data Analyst, Data Scientist, Business Analyst, and more.

Real-World Applications

Throughout the course, you’ll work with actual datasets, learning how to clean, manipulate, and analyze data just like professional data analysts do. This hands-on experience is key to preparing you for the challenges of real-world data analysis.

Easy-to-Learn

Python is known for being beginner-friendly, and this course breaks down complex concepts into easy-to-understand lessons. Whether you're new to programming or data analysis, this course is designed to help you learn at your own pace.

Career-Boosting Certification

Upon completing the course, you’ll receive a certificate from Coursera and IBM, a recognized leader in data science. This certificate can add significant value to your resume and LinkedIn profile, helping you stand out in the competitive job market.

Who Should Take This Course?

  • Beginners to Python: If you're new to Python or programming in general, this course provides a solid introduction to Python specifically for data analysis.
  • Aspiring Data Analysts: If you want to break into the data analysis field, this course gives you all the tools and skills you need to get started.
  • Current Data Professionals: If you're already working in data but want to strengthen your Python skills, this course helps you deepen your knowledge and apply new techniques to your workflow.
  • Students and Professionals: If you're in academia or a professional field and want to analyze data more effectively, this course is suitable for anyone who deals with data in their work.

Join Free: Data Analysis with Python

Join the session for free: Data Analysis with Python

Conclusion

The Data Analysis with Python course on Coursera is an excellent starting point for anyone looking to enter the world of data science and analytics. With practical, hands-on learning, you’ll gain the skills needed to clean, analyze, and visualize data, and transform raw data into actionable insights.

By mastering Python for data analysis, you’ll be well-equipped to tackle real-world challenges and enhance your career prospects in this rapidly growing field. So, whether you're starting from scratch or looking to level up your skills, this course is the perfect way to get started with data analysis.

Ready to start analyzing data? Enroll in the course today on Coursera and take your first step towards becoming a skilled data analyst. 

Saturday, 18 July 2026

Extending Excel with Python and R: Unlock the potential of analytics languages for advanced data manipulation and visualization


Extending Excel with Python and R: Unlock Advanced Data Analysis, Automation, and Visualization Beyond Traditional Spreadsheets

Introduction

Microsoft Excel has been the world's most widely used spreadsheet application for decades, helping professionals organize data, perform calculations, create reports, and build dashboards. However, as organizations generate larger datasets and demand more advanced analytics, Excel alone can struggle with statistical modeling, machine learning, automation, and sophisticated data visualization.

This is where Python and R become game changers. Python excels in automation, data engineering, artificial intelligence, and machine learning, while R is renowned for statistical computing, exploratory data analysis, and high-quality visualizations. By integrating these powerful programming languages with Excel, analysts can dramatically extend Excel's capabilities without abandoning the familiar spreadsheet environment. Recent advances in tools and workflows make combining Excel with Python and R increasingly practical for data professionals.

Extending Excel with Python and R: Unlock the Potential of Analytics Languages for Advanced Data Manipulation and Visualization, written by Steven Sanderson and David Kun, is a practical guide published by Packt in April 2024. Across 344 pages, the book teaches readers how to combine Excel with Python and R to automate repetitive tasks, perform advanced statistical analysis, create professional visualizations, integrate APIs, and build more efficient data workflows.


Get It Free: https://support.microsoft.com/en-US/Excel/python/introduction-to-python-in-excel

Why Extend Excel with Python and R?

Excel is excellent for many business tasks, but advanced analytics often require more powerful programming tools.

By integrating Python and R with Excel, you can:

  • Automate repetitive spreadsheet tasks

  • Perform advanced statistical analysis

  • Build machine learning models

  • Create publication-quality visualizations

  • Process large datasets more efficiently

  • Connect Excel to external APIs

  • Develop reproducible analytical workflows

This combination allows professionals to keep Excel as a familiar interface while leveraging the strengths of modern data science ecosystems.


Book Overview

The book focuses on practical integration rather than theory alone.

Readers learn how to:

  • Read and write Excel files

  • Automate spreadsheet workflows

  • Use Python and R for analytics

  • Generate advanced charts

  • Connect Excel with APIs

  • Perform statistical analysis

  • Execute VBA through Python and R

  • Build reusable automation scripts

Every chapter combines explanations with hands-on examples that can be applied to real business scenarios.


Reading and Writing Excel Files

The book begins with the fundamentals of working with spreadsheets programmatically.

Topics include:

  • Importing Excel workbooks

  • Reading multiple worksheets

  • Managing workbook structures

  • Writing processed data back to Excel

  • Handling large spreadsheets efficiently

Readers learn to use popular Python and R libraries for seamless spreadsheet interaction.


Data Manipulation with Python

Python provides powerful tools for transforming and analyzing spreadsheet data.

The book explores:

  • Pandas DataFrames

  • Data cleaning

  • Filtering

  • Aggregation

  • Data transformation

  • Merging datasets

  • Handling missing values

These techniques simplify tasks that would otherwise require complex Excel formulas or manual operations.


Statistical Analysis with R

R has long been one of the leading languages for statistics.

Readers learn how to perform:

  • Exploratory Data Analysis (EDA)

  • Statistical summaries

  • Hypothesis testing

  • Time series analysis

  • Data modeling

  • Predictive analytics

Integrating R with Excel enables analysts to apply sophisticated statistical methods while maintaining familiar spreadsheet workflows.


Advanced Data Visualization

One of the book's major strengths is its emphasis on professional visualization.

Readers create charts using:

  • ggplot2 in R

  • Matplotlib in Python

  • Customized plots

  • Interactive visualizations

  • Business reports

These libraries produce publication-quality graphics that extend far beyond Excel's native charting capabilities.


Automating Excel Workflows

Automation saves countless hours in repetitive reporting tasks.

The book demonstrates how to:

  • Automate report generation

  • Schedule spreadsheet processing

  • Execute repetitive calculations

  • Refresh data automatically

  • Build reusable automation scripts

Automation improves productivity while reducing manual errors.


Integrating VBA with Python and R

Many organizations still rely on Excel VBA.

Rather than replacing VBA completely, the book explains how to combine it with Python and R.

Topics include:

  • Calling Python from Excel

  • Calling R from Excel

  • Executing VBA macros

  • Hybrid automation workflows

  • Improving legacy Excel solutions

This approach helps organizations modernize existing spreadsheet systems without rebuilding them from scratch.


Exploratory Data Analysis (EDA)

Exploratory Data Analysis is essential before building predictive models.

The book introduces techniques such as:

  • Summary statistics

  • Distribution analysis

  • Correlation analysis

  • Pivot table exploration

  • Trend identification

  • Outlier detection

These methods help uncover hidden insights within business data.


Time Series Analysis

Many organizations work with chronological data.

Readers learn techniques for:

  • Forecasting

  • Trend analysis

  • Seasonal decomposition

  • Time-based visualization

  • Financial analysis

Time series capabilities make the book valuable for finance, operations, and business intelligence professionals.


API Integration

Modern analytics frequently require external data sources.

The book demonstrates how to:

  • Access web APIs

  • Import online datasets

  • Automate data retrieval

  • Combine external data with Excel

  • Build dynamic reporting systems

API integration enables Excel workbooks to stay current with real-time information.


Practical Business Applications

The techniques covered support many real-world use cases.

Financial Analysis

Automating financial reports and forecasting.

Sales Analytics

Analyzing customer and revenue trends.

Business Intelligence

Creating interactive dashboards.

Data Science

Preparing datasets for machine learning.

Research

Performing statistical analysis and visualization.

Operations

Automating recurring Excel-based workflows.


Skills You Will Develop

By reading this book, you will strengthen expertise in:

  • Microsoft Excel

  • Python Programming

  • R Programming

  • Data Analysis

  • Data Manipulation

  • Exploratory Data Analysis (EDA)

  • Statistical Computing

  • Data Visualization

  • Pandas

  • ggplot2

  • Matplotlib

  • Excel Automation

  • VBA Integration

  • API Integration

  • Time Series Analysis

  • Business Intelligence

  • Workflow Automation

  • Data Science

These skills are valuable for analysts, developers, and data professionals working with spreadsheet-based workflows.


Who Should Read This Book?

This book is ideal for:

Data Analysts

Expanding Excel with advanced analytics.

Business Analysts

Automating reporting and dashboards.

Financial Analysts

Performing statistical and forecasting analysis.

Data Scientists

Integrating programming workflows with Excel.

Excel Power Users

Learning Python and R without abandoning spreadsheets.

Students

Developing practical data analysis skills.

Readers should have a basic understanding of Excel, while introductory familiarity with Python or R is helpful but not essential.


Why This Book Stands Out

Several features make this book particularly valuable:

  • Practical, project-based approach

  • Covers both Python and R integration

  • Strong focus on Excel automation

  • Explains statistical analysis techniques

  • Includes modern visualization libraries

  • Demonstrates API connectivity

  • Suitable for beginners and intermediate learners

  • Bridges traditional spreadsheets with modern data science workflows


Career Benefits

The knowledge gained from this book supports careers such as:

  • Data Analyst

  • Business Intelligence Analyst

  • Financial Analyst

  • Data Scientist

  • Business Analyst

  • Reporting Analyst

  • Excel Developer

  • Automation Engineer

  • Analytics Consultant

  • Operations Analyst

As organizations increasingly combine spreadsheets with modern analytics platforms, professionals who can integrate Excel with Python and R have a significant competitive advantage.


Hard Copy: Extending Excel with Python and R: Unlock the potential of analytics languages for advanced data manipulation and visualization

Kindle: Extending Excel with Python and R: Unlock the potential of analytics languages for advanced data manipulation and visualization

Conclusion

Extending Excel with Python and R is an excellent resource for professionals who want to move beyond traditional spreadsheet capabilities and embrace modern data analytics. By combining Excel with the analytical power of Python and R, the book demonstrates how to automate workflows, perform sophisticated statistical analysis, create compelling visualizations, and build scalable reporting solutions.

By covering:

  • Excel Automation

  • Python Programming

  • R Programming

  • Data Manipulation

  • Exploratory Data Analysis

  • Statistical Computing

  • Data Visualization

  • Pandas

  • ggplot2

  • Matplotlib

  • VBA Integration

  • API Connectivity

  • Time Series Analysis

  • Business Intelligence

  • Workflow Automation

  • Advanced Spreadsheet Analytics

the book equips readers with practical skills that bridge the gap between traditional spreadsheet work and modern data science.

Whether you are a data analyst, financial professional, business analyst, Excel power user, or aspiring data scientist, Extending Excel with Python and R provides a practical roadmap for transforming Excel into a powerful analytics platform capable of handling today's increasingly complex data challenges.

Saturday, 4 October 2025

Data Analysis and Visualization with Python


Data Analysis and Visualization with Python

1. Introduction

Data analysis and visualization have become essential components in understanding the vast amounts of information generated in today’s world. Python, with its simplicity and flexibility, has emerged as one of the most widely used languages for these tasks. Unlike traditional methods that relied heavily on manual calculations or spreadsheet tools, Python allows analysts and researchers to process large datasets efficiently, apply statistical and machine learning techniques, and generate visual representations that reveal insights in a clear and compelling way. The integration of analysis and visualization in Python enables users to not only understand raw data but also communicate findings effectively to stakeholders.

2. Importance of Data Analysis

Data analysis is the systematic process of inspecting, cleaning, transforming, and modeling data to discover useful information, draw conclusions, and support decision-making. It is critical because raw data in its native form is often messy, inconsistent, and unstructured. Without proper analysis, organizations may make decisions based on incomplete or misleading information. Python, through its ecosystem of libraries, allows for rapid exploration of data patterns, identification of trends, and detection of anomalies. This capability is vital in fields such as business analytics, finance, healthcare, scientific research, and social sciences, where decisions based on accurate and timely insights can have significant impacts.

3. Why Python for Data Analysis and Visualization

Python has become the preferred language for data analysis due to its readability, extensive library support, and active community. Its simplicity allows beginners to grasp fundamental concepts quickly, while its powerful tools enable experts to handle complex analytical tasks. Libraries such as Pandas provide high-level structures for working with structured data, while NumPy allows efficient numerical computations. Visualization libraries like Matplotlib and Seaborn transform abstract data into graphical forms, making it easier to detect trends, correlations, and outliers. Additionally, Python supports integration with advanced analytical tools, machine learning frameworks, and cloud-based data pipelines, making it a comprehensive choice for both analysis and visualization.

4. Data Cleaning and Preprocessing

One of the most crucial steps in any data analysis project is cleaning and preprocessing the data. Real-world datasets are often incomplete, inconsistent, or contain errors such as missing values, duplicates, or incorrect formatting. Data preprocessing involves identifying and correcting these issues to ensure accurate analysis. Python provides tools to standardize formats, handle missing or corrupted entries, and transform data into a form suitable for analysis. This stage is critical because the quality of insights obtained depends directly on the quality of data used. Proper preprocessing ensures that downstream analysis and visualizations are reliable, reproducible, and free from misleading artifacts.

5. Exploratory Data Analysis (EDA)

Exploratory Data Analysis (EDA) is the process of examining datasets to summarize their main characteristics and uncover underlying patterns without making prior assumptions. Through EDA, analysts can detect trends, distributions, anomalies, and relationships among variables. Python facilitates EDA by offering a combination of statistical and graphical tools that allow a deeper understanding of data structures. Summarizing data with descriptive statistics and visualizing it using histograms, scatter plots, and box plots enables analysts to form hypotheses, identify potential data issues, and prepare for more sophisticated modeling or predictive tasks. EDA is fundamental because it bridges the gap between raw data and actionable insights.

6. Data Visualization and Its Significance

Data visualization transforms numerical or categorical data into graphical representations that are easier to understand, interpret, and communicate. Visualizations allow humans to recognize patterns, trends, and outliers that may not be immediately apparent in tabular data. Python provides powerful visualization libraries such as Matplotlib, Seaborn, and Plotly, which enable the creation of static, dynamic, and interactive plots. Effective visualization is not merely decorative; it is a critical step in storytelling with data. By representing data visually, analysts can convey complex information succinctly, support decision-making, and engage stakeholders in interpreting results accurately.

7. Python Libraries for Visualization

Several Python libraries have become standard tools for visualization due to their capabilities and ease of use. Matplotlib provides a foundational platform for creating static plots, offering precise control over graphical elements. Seaborn, built on top of Matplotlib, simplifies the creation of statistical plots and enhances aesthetic quality. Plotly enables interactive and dynamic visualizations, making it suitable for dashboards and web applications. These libraries allow analysts to represent data across multiple dimensions, integrate statistical insights directly into visual forms, and create customizable charts that effectively communicate analytical results.

8. Integration of Analysis and Visualization

Data analysis and visualization are complementary processes. Analysis without visualization may miss patterns that are visually evident, while visualization without analysis may fail to provide interpretative depth. Python allows seamless integration between analytical computations and graphical representations, enabling a workflow where data can be cleaned, explored, analyzed, and visualized within a single environment. This integration accelerates insight discovery, improves accuracy, and supports a more comprehensive understanding of data. In professional settings, such integration enhances collaboration between analysts, managers, and decision-makers by providing clear and interpretable results.

9. Challenges in Data Analysis and Visualization

Despite Python’s advantages, data analysis and visualization come with challenges. Large datasets may require significant computational resources, and poorly cleaned data can lead to incorrect conclusions. Selecting appropriate visualization techniques is critical, as inappropriate choices may misrepresent patterns or relationships. Additionally, analysts must consider audience understanding; overly complex visualizations can confuse rather than clarify. Python helps mitigate these challenges through optimized libraries, robust preprocessing tools, and flexible visualization frameworks, but success ultimately depends on analytical rigor and thoughtful interpretation.

Join Now: Data Analysis and Visualization with Python

Join the session for free : Data Analysis and Visualization with Python


10. Conclusion

Data analysis and visualization with Python represent a powerful combination that transforms raw data into meaningful insights. Python’s simplicity, rich ecosystem, and visualization capabilities make it an indispensable tool for professionals across industries. By enabling systematic analysis, effective data cleaning, exploratory examination, and impactful visual storytelling, Python allows analysts to uncover patterns, detect trends, and communicate findings efficiently. As data continues to grow in volume and complexity, mastering Python for analysis and visualization will remain a key skill for anyone looking to leverage data to drive decisions and innovation.

Wednesday, 5 August 2026

Exploratory Data Analysis With Python and Pandas


Before building machine learning models or creating business dashboards, every successful data science project begins with one essential step—Exploratory Data Analysis (EDA). EDA is the process of understanding a dataset by examining its structure, identifying patterns, detecting anomalies, handling missing values, and uncovering relationships between variables. It helps analysts transform raw data into meaningful insights while ensuring data quality before any predictive modeling begins.

Python has become the preferred language for Exploratory Data Analysis because of its rich ecosystem of libraries. Pandas simplifies data manipulation, NumPy supports numerical computations, while Matplotlib and Seaborn provide powerful visualization capabilities. Together, these tools enable analysts to efficiently clean, summarize, visualize, and interpret datasets.

Exploratory Data Analysis With Python and Pandas is a beginner-friendly Coursera Guided Project designed to teach practical EDA techniques in approximately two hours. Through hands-on exercises, learners perform data exploration, univariate and bivariate analysis, correlation analysis, and data cleaning using Python libraries such as Pandas, NumPy, Matplotlib, and Seaborn. The project focuses on real-world analytical workflows rather than theoretical concepts, making it ideal for aspiring data analysts and data scientists.

Whether you are a beginner in data science, a Python programmer, or someone preparing for machine learning, this project provides an excellent introduction to professional exploratory data analysis.


Why Learn Exploratory Data Analysis?

EDA is one of the most important skills in data science because it helps you understand your data before building models.

Learning EDA enables you to:

  • Understand dataset structure

  • Detect missing values

  • Identify duplicate records

  • Discover hidden patterns

  • Visualize relationships

  • Improve data quality

  • Prepare datasets for machine learning

  • Generate business insights

In real-world projects, analysts often spend more time exploring and cleaning data than building predictive models.


Project Overview

The guided project introduces practical exploratory data analysis using Python.

Major topics include:

  • Introduction to EDA

  • Pandas

  • NumPy

  • Data Exploration

  • Data Cleaning

  • Missing Value Analysis

  • Duplicate Detection

  • Univariate Analysis

  • Bivariate Analysis

  • Correlation Analysis

  • Data Visualization

  • Matplotlib

  • Seaborn

  • Statistical Summary

The project emphasizes learning by doing, allowing participants to work directly with datasets inside a cloud-based environment without installing software.


Introduction to Exploratory Data Analysis

The course begins by explaining why exploratory analysis is essential.

Readers learn about:

  • Understanding Data

  • Dataset Inspection

  • Variable Types

  • Data Quality

  • Statistical Exploration

  • Business Understanding

EDA provides the foundation for reliable decision-making and predictive analytics.


Working with Pandas

Pandas is the primary library used throughout the project.

Topics include:

  • DataFrames

  • Series

  • Reading CSV Files

  • Viewing Data

  • Selecting Columns

  • Filtering Rows

Pandas enables analysts to manipulate structured data quickly and efficiently.


Using NumPy

NumPy provides high-performance numerical operations.

Readers explore:

  • Arrays

  • Mathematical Operations

  • Numerical Computation

  • Statistical Functions

  • Efficient Data Processing

NumPy works seamlessly with Pandas to support large-scale data analysis.


Initial Data Exploration

The first step in any EDA workflow is understanding the dataset.

The project demonstrates how to:

  • Display Dataset Structure

  • Examine Column Names

  • Check Data Types

  • Count Observations

  • Generate Summary Statistics

These initial steps provide an overview of the available information before deeper analysis begins.


Univariate Analysis

Univariate analysis focuses on understanding one variable at a time.

Topics include:

  • Frequency Distribution

  • Histograms

  • Box Plots

  • Value Counts

  • Summary Statistics

This analysis helps identify trends, skewness, and potential outliers within individual features.


Bivariate Analysis

Bivariate analysis examines relationships between two variables.

Readers learn:

  • Scatter Plots

  • Group Comparisons

  • Categorical Relationships

  • Numerical Relationships

  • Pairwise Analysis

These techniques reveal correlations and interactions between variables.


Handling Missing Values

Missing data is one of the most common challenges in data analysis.

The course explains:

  • Identifying Missing Values

  • Null Value Detection

  • Missing Data Visualization

  • Removing Missing Values

  • Imputation Techniques

Proper handling of missing values improves both analysis quality and model performance.


Detecting Duplicate Records

Duplicate observations can distort analytical results.

Topics include:

  • Duplicate Detection

  • Duplicate Removal

  • Data Integrity

  • Record Validation

Cleaning duplicate data ensures more accurate statistical analysis.


Correlation Analysis

Understanding relationships between numerical variables is a core part of EDA.

Readers explore:

  • Correlation Matrix

  • Pearson Correlation

  • Heatmaps

  • Feature Relationships

  • Variable Dependencies

Correlation analysis helps identify highly related variables and potential predictors.


Data Visualization with Matplotlib

Matplotlib enables effective graphical representation of data.

Topics include:

  • Line Charts

  • Histograms

  • Bar Charts

  • Scatter Plots

  • Figure Customization

Visualizations make patterns easier to interpret than numerical summaries alone.


Data Visualization with Seaborn

Seaborn builds on Matplotlib by providing attractive statistical graphics.

Readers learn about:

  • Distribution Plots

  • Pair Plots

  • Heatmaps

  • Count Plots

  • Box Plots

These visualizations simplify exploratory analysis and reveal hidden trends.


Statistical Summary

The project introduces descriptive statistics commonly used in EDA.

Topics include:

  • Mean

  • Median

  • Standard Deviation

  • Variance

  • Minimum

  • Maximum

  • Quartiles

These statistics provide a concise overview of dataset characteristics.


Practical Workflow for EDA

By the end of the project, learners follow a structured EDA workflow:

  1. Import the dataset.

  2. Inspect data structure.

  3. Explore variables.

  4. Clean missing and duplicate records.

  5. Perform univariate analysis.

  6. Perform bivariate analysis.

  7. Compute correlations.

  8. Create visualizations.

  9. Summarize insights.

This workflow mirrors the process followed by professional data analysts.


Real-World Applications

Exploratory Data Analysis is used across many industries.

Business Analytics

Understanding customer behavior.

Finance

Transaction analysis and fraud detection.

Healthcare

Patient data exploration.

Marketing

Customer segmentation and campaign analysis.

Retail

Sales trend analysis.

Manufacturing

Quality monitoring.

Education

Student performance analysis.

Government

Population and policy analysis.

EDA serves as the first step in almost every data-driven decision-making process.


Skills You Will Develop

By completing this guided project, learners strengthen expertise in:

  • Exploratory Data Analysis

  • Python Programming

  • Pandas

  • NumPy

  • Data Cleaning

  • Data Wrangling

  • Missing Value Analysis

  • Duplicate Detection

  • Correlation Analysis

  • Statistical Analysis

  • Matplotlib

  • Seaborn

  • Data Visualization

These skills are fundamental for careers in data analytics, machine learning, and business intelligence.


Who Should Take This Project?

This guided project is ideal for:

Beginners

Learning data analysis from scratch.

Data Analysts

Improving practical EDA skills.

Data Scientists

Strengthening data preparation workflows.

Python Developers

Expanding into data science.

Students

Preparing for machine learning and analytics courses.

Basic Python knowledge is helpful, while prior experience with statistics is recommended but not mandatory. The project is beginner-friendly and focuses on practical application.


Why This Project Stands Out

Several features distinguish this guided project:

  • Hands-on learning in approximately two hours

  • Uses industry-standard Python libraries

  • No software installation required

  • Covers complete EDA workflow

  • Includes practical data cleaning techniques

  • Focuses on visualization and statistical exploration

  • Beginner-friendly with guided instruction

Its short duration and practical focus make it an excellent introduction to real-world data analysis.


Career Benefits

Mastering Exploratory Data Analysis prepares learners for roles such as:

  • Data Analyst

  • Junior Data Scientist

  • Business Intelligence Analyst

  • Python Data Analyst

  • Machine Learning Engineer

  • Research Analyst

  • Business Analyst

  • Analytics Consultant

EDA is one of the most frequently used skills in professional data science workflows and is essential before developing predictive models.


Join Now : Exploratory Data Analysis With Python and Pandas

Conclusion

Exploratory Data Analysis With Python and Pandas provides a practical introduction to one of the most important stages of the data science lifecycle. By teaching learners how to inspect datasets, clean missing and duplicate records, perform statistical analysis, create informative visualizations, and uncover meaningful relationships between variables, the project builds the essential skills needed for successful data analysis and machine learning. Using powerful Python libraries such as Pandas, NumPy, Matplotlib, and Seaborn, learners gain hands-on experience with the same tools used by professional data analysts worldwide.

By covering:

  • Exploratory Data Analysis

  • Python

  • Pandas

  • NumPy

  • Data Cleaning

  • Missing Value Handling

  • Duplicate Detection

  • Univariate Analysis

  • Bivariate Analysis

  • Correlation Analysis

  • Matplotlib

  • Seaborn

  • Statistical Analysis

  • Data Visualization

the project provides an excellent starting point for anyone beginning a career in data science, analytics, or machine learning.

Whether your goal is to become a Data Analyst, Data Scientist, Business Intelligence Analyst, Machine Learning Engineer, or Python Developer, Exploratory Data Analysis With Python and Pandas offers a practical and industry-relevant foundation for understanding and analyzing real-world datasets.

Tuesday, 28 January 2025

Applying Python for Data Analysis


Applying Python for Data Analysis

In the modern data-driven world, understanding how to analyze and interpret data effectively is essential for professionals across all industries. Python, known for its simplicity and powerful libraries, has become the go-to programming language for data analysis.  "Applying Python for Data Analysis" course is a top-tier offering that empowers learners to gain hands-on experience and expertise in Python-based data analysis techniques. This blog delves deep into what the course entails, its key features, and why it is a must-take for aspiring data analysts.

Course Overview

The "Applying Python for Data Analysis" course is structured to guide learners from the fundamentals of data analysis to implementing advanced techniques with Python. Whether you’re a beginner or have some experience with Python, the course provides a step-by-step approach to mastering data analysis tools and concepts.

Key aspects of the course include:

Introduction to Data Analysis:

  • Overview of data analysis and its applications across industries.
  • Understanding different types of data (structured, unstructured, categorical, numerical).
  • Setting up the Python environment for data analysis.

Data Manipulation with Pandas:

  • Introduction to the Pandas library, a versatile tool for data manipulation.
  • Reading, cleaning, and transforming data using Pandas.
  • Handling missing data, filtering datasets, and performing data aggregation.

Data Visualization Techniques:

  • Understanding the importance of visual storytelling in data analysis.
  • Utilizing Matplotlib and Seaborn libraries to create graphs, charts, and plots.
  • Advanced visualization techniques such as heatmaps, pair plots, and time-series plots.

Hands-on Real-World Projects:

  • Working with real-world datasets from domains like healthcare, finance, and e-commerce.
  • Performing exploratory data analysis (EDA) to uncover patterns and insights.
  • Building data pipelines for end-to-end analysis.

Advanced Topics

  • Introduction to NumPy for numerical operations.
  • Basics of working with time-series data.
  • Overview of machine learning applications in data analysis.

Key Features of the Course

Practical Learning Approach:The course emphasizes hands-on learning through practical examples and real-world datasets. Each module includes exercises that allow learners to apply theoretical knowledge immediately.

Focus on Industry-Relevant Tools: Learners get familiar with essential Python libraries such as Pandas, Matplotlib, and Seaborn, which are widely used in the data analytics industry.

Flexibility and Accessibility: As an online course, it’s self-paced, allowing learners to balance their studies with other commitments. The course content is accessible anytime, making it easy for learners to revisit concepts.

Guidance from Experts: The course is designed and taught by experienced instructors with deep expertise in Python and data analysis. Their insights and tips help learners overcome challenges and gain practical proficiency.

Capstone Project :The capstone project at the end of the course enables learners to showcase their skills by solving a real-world data problem. This project serves as a valuable addition to portfolios.

Why Should You Take This Course?

Beginner-Friendly: If you are new to data analysis or Python programming, this course provides a comprehensive introduction with no prior experience required.

Career Advancement: Data analysis is a highly sought-after skill in today’s job market. Completing this course can significantly enhance your resume and open doors to roles such as Data Analyst, Business Analyst, or Data Scientist.

Applicable Across Industries: The skills you gain from this course are applicable across industries, including healthcare, finance, marketing, and technology.

Affordable Learning: Coursera’s financial aid and subscription plans make this high-quality education accessible to learners worldwide.

Portfolio Building: By working on projects and assignments, you’ll build a portfolio that demonstrates your ability to handle real-world data challenges.

Who Should Enroll?

Students and professionals aspiring to build a career in data analysis.

Individuals with basic Python knowledge looking to specialize in data analysis.

Professionals from non-technical backgrounds seeking to upskill in data analytics.

Entrepreneurs and business owners who want to make data-driven decisions.

What you'll learn

  • Construct and manipulate data structures using Pandas. 
  • Analyze and visualize data sets to extract meaningful insights. 
  • Evaluate and apply advanced data analysis techniques such as time series analysis and data aggregation.

Learning Outcomes

By the end of the course, learners will:

  • Gain proficiency in using Python libraries like Pandas, Matplotlib, and Seaborn.
  • Understand how to manipulate, clean, and transform datasets.
  • Develop the ability to create compelling data visualizations.
  • Learn how to analyze and interpret data to derive actionable insights.
  • Build a capstone project to demonstrate their skills.

Join Free : Applying Python for Data Analysis

Conclusion

The "Applying Python for Data Analysis" course on Coursera is a gateway to mastering one of the most in-demand skills of the 21st century. Its hands-on approach, expert instruction, and real-world relevance make it a perfect choice for anyone looking to excel in data analytics. Whether you’re a student, a working professional, or a business owner, this course equips you with the tools and knowledge to make data-driven decisions and advance your career. Don’t miss this opportunity to unlock the power of Python for data analysis!


Tuesday, 18 February 2025

PRACTICAL DATA SCIENCE WITH R AND PYTHON: A Hands-On Approach to Solving Data Problems with R and Python


Practical Data Science with R and Python: A Hands-On Guide to Real-World Data Problems

Practical Data Science with R and Python: A Hands-On Approach to Solving Data Problems with R and Python Master the art of data science with Practical Data Science with R and Python, a comprehensive guide for aspiring data scientists, analysts, and professionals eager to leverage the power of R and Python to solve real-world data challenges. This hands-on book combines the strengths of these two leading data science tools to provide practical solutions to common data problems, helping you make data-driven decisions with confidence .In today’s data-driven world, businesses and organizations rely on data science to uncover insights, make informed decisions, and drive innovation. If you’re looking for a practical and hands-on approach to solving data problems, "PRACTICAL DATA SCIENCE WITH R AND PYTHON" is an excellent guide that bridges the gap between theory and application.


Why This Book?

This book is unique because it teaches both R and Python, two of the most widely used programming languages in data science. It’s perfect for professionals and students who want to compare and leverage the strengths of each language in different scenarios.

Comprehensive yet practical – Learn data science by working on real-world problems.

Side-by-side R and Python examples – Compare implementations in both languages.

Covers the entire data science workflow – From data wrangling to machine learning.

Ideal for all levels – Whether you're a beginner or an experienced professional.

Key Topics Covered in the Book

1. Introduction to Data Science

The role of data science in business and research.

How R and Python differ and complement each other.

Setting up your data science environment.

2. Data Wrangling and Exploration

Data cleaning and preprocessing techniques.

Working with Pandas (Python) and dplyr (R).

Data visualization with ggplot2 (R) and Matplotlib/Seaborn (Python).

3. Statistical Analysis and Hypothesis Testing

Descriptive and inferential statistics.

A/B testing and experimental design.

Using statsmodels (Python) and base R functions.

4. Machine Learning with R and Python

Implementing supervised and unsupervised learning.

Regression, classification, and clustering techniques.

Using Scikit-learn (Python) and caret (R).

5. Practical Applications of Data Science

Predictive modeling for business intelligence.

Sentiment analysis and text mining.

Time series forecasting and recommendation systems.

Why Learn Both R and Python?

While Python is widely used for machine learning and automation, R excels in statistical analysis and data visualization. Learning both allows you to:

Leverage Python's power for AI and deep learning

Use R's statistical capabilities for in-depth data analysis

Work across different teams and industries

Many companies prefer data scientists who are proficient in both, as it provides flexibility in handling diverse projects.


What You’ll Learn:

Getting Started with R and Python: Set up your environment and learn the basics of both R and Python for data science.

Data Wrangling and Cleaning: Handle messy datasets with Pandas in Python and dplyr in R to prepare data for analysis.

Exploratory Data Analysis (EDA): Uncover patterns, trends, and insights in data using visualization libraries like ggplot2 (R) and Matplotlib (Python).

Statistical Analysis: Perform descriptive and inferential statistics to test hypotheses and summarize data.

Machine Learning Basics: Build and evaluate predictive models using scikit-learn (Python) and caret (R).

Data Visualization: Create compelling and interactive visualizations with R’s Shiny and Python’s Plotly libraries.

Big Data Processing: Learn to work with large datasets using tools like SparkR, Dask, and PySpark.

Time-Series Analysis: Analyze and forecast time-series data with ARIMA and Prophet in both R and Python.

Text Mining and Natural Language Processing: Extract insights from unstructured text data using libraries like tidytext (R) and NLTK (Python).

Handling Geospatial Data: Visualize and analyze geospatial data with GeoPandas (Python) and sf (R).

Integration and Automation: Combine R and Python workflows to streamline repetitive tasks and maximize efficiency.

Model Deployment: Learn to deploy your data science models into production environments with Flask (Python) and RStudio Connect.

Real-World Applications: Work through projects including fraud detection, customer segmentation, and recommendation systems.

Collaborating and Version Control: Utilize Git and GitHub to manage and share your projects effectively.

Who Is This Book For?

Who Should Read This Book?

Data Analysts & Scientists – Expand your skill set with both R and Python.

Business Professionals – Learn data-driven decision-making techniques.

Students & Researchers – Apply real-world data science methodologies.

Programmers & Engineers – Transition into the field of data science.

Hard Copy : PRACTICAL DATA SCIENCE WITH R AND PYTHON: A Hands-On Approach to Solving Data Problems with R and Python


Kindle : PRACTICAL DATA SCIENCE WITH R AND PYTHON: A Hands-On Approach to Solving Data Problems with R and Python

Conclusion : 

If you want a hands-on, practical guide to solving real-world data science problems, PRACTICAL DATA SCIENCE WITH R AND PYTHON is the perfect book. It not only teaches theory and coding but also focuses on problem-solving approaches used in industry.

With side-by-side examples in R and Python, you’ll gain a strong foundation in data science and be prepared for real-world challenges.

Tuesday, 7 July 2026

Python for Data Analysis: The Modern Guide to Scalable Data, Advanced Models, and Automation (Data Analytics Toolkit)( Free PDF)


Python for Data Analysis: The Modern Guide to Scalable Data, Advanced Models, and Automation

Introduction

In today's data-driven world, organizations generate enormous volumes of information every second. From customer transactions and social media interactions to IoT sensor readings and financial records, businesses rely on data to improve decision-making, optimize operations, and create innovative products and services. However, raw data has little value unless it can be collected, cleaned, analyzed, visualized, and transformed into actionable insights. This is where Python for Data Analysis has become an indispensable skill for data professionals.

Python has established itself as the leading programming language for data analytics, machine learning, and artificial intelligence because of its simplicity, flexibility, and extensive ecosystem of powerful libraries. Tools such as NumPy, Pandas, Matplotlib, Plotly, Scikit-learn, and workflow automation frameworks allow analysts and data scientists to process massive datasets, build predictive models, automate repetitive tasks, and create scalable analytical solutions.

Python for Data Analysis: The Modern Guide to Scalable Data, Advanced Models, and Automation is designed to help readers master modern data analysis techniques using Python. The book combines foundational programming concepts with advanced data processing, scalable analytics, predictive modeling, automation workflows, and real-world business applications. Through practical examples and hands-on projects, readers learn how to work efficiently with large datasets while developing skills that are highly valued across industries. Whether you are a student, data analyst, software developer, business intelligence professional, or aspiring data scientist, this book provides a comprehensive roadmap for building modern data analysis expertise.


Why Learn Python for Data Analysis?

Python has become the preferred programming language for data professionals worldwide.

Its popularity is driven by:

  • Simple and readable syntax

  • Rich ecosystem of analytical libraries

  • Cross-platform compatibility

  • Strong community support

  • Excellent machine learning integration

  • Automation capabilities

Python enables analysts to move efficiently from raw data to actionable insights while supporting scalable analytical workflows.


Understanding Data Analysis

The book begins by introducing the role of data analysis in solving business and scientific problems.

Readers explore:

  • What data analysis is

  • Types of data

  • Data-driven decision-making

  • Analytical workflows

  • Exploratory data analysis (EDA)

These concepts establish the foundation for practical Python-based analytics.


Python Programming Essentials

Before working with datasets, readers strengthen their Python programming skills.

Topics include:

  • Variables

  • Data types

  • Functions

  • Loops

  • Conditional statements

  • Lists

  • Dictionaries

  • Modules

These programming fundamentals support efficient data manipulation and automation.


Working with NumPy

NumPy provides the foundation for scientific computing in Python.

The book explains:

  • Arrays

  • Vectorized operations

  • Matrix computations

  • Mathematical functions

  • Numerical optimization

NumPy enables efficient processing of large numerical datasets while improving computational performance.


Data Manipulation with Pandas

Pandas is one of the most important libraries for data analysis.

Readers learn how to:

  • Import datasets

  • Create DataFrames

  • Filter records

  • Handle missing values

  • Merge datasets

  • Group and aggregate data

  • Transform information

Pandas simplifies complex data manipulation tasks that would otherwise require extensive manual coding.


Data Cleaning

Real-world datasets are often incomplete or inconsistent.

The book covers practical data cleaning techniques including:

  • Handling missing values

  • Removing duplicates

  • Correcting formatting issues

  • Standardizing data

  • Data validation

Effective data cleaning improves both analytical accuracy and machine learning performance.


Exploratory Data Analysis (EDA)

Exploratory Data Analysis helps analysts understand datasets before modeling.

Readers explore:

  • Summary statistics

  • Distribution analysis

  • Correlation analysis

  • Outlier detection

  • Pattern identification

EDA supports better decision-making by revealing hidden insights within data.


Data Visualization

Visual communication plays a central role in data analysis.

The book introduces visualization techniques using Python libraries.

Readers create:

  • Line charts

  • Bar graphs

  • Scatter plots

  • Histograms

  • Box plots

  • Heatmaps

Well-designed visualizations help stakeholders understand complex analytical findings quickly.


Working with Large Datasets

Modern organizations frequently manage datasets containing millions of records.

The book discusses strategies for:

  • Efficient data loading

  • Memory optimization

  • Large-scale processing

  • Performance improvement

These techniques allow analysts to work effectively with scalable data pipelines.


Advanced Data Analysis

The book extends beyond basic analytics by introducing advanced analytical methods.

Topics include:

  • Statistical analysis

  • Trend analysis

  • Correlation studies

  • Predictive analytics

  • Feature engineering

These methods enable deeper understanding of complex datasets.


Predictive Modeling

Python supports powerful predictive analytics workflows.

Readers explore concepts including:

  • Regression models

  • Classification models

  • Model training

  • Model evaluation

  • Prediction

Predictive modeling allows organizations to anticipate future outcomes using historical data.


Machine Learning Integration

The book demonstrates how data analysis connects directly with machine learning.

Readers understand how analytical workflows support:

  • Data preprocessing

  • Feature selection

  • Model development

  • Performance evaluation

This integration prepares learners for more advanced artificial intelligence projects.


Automation with Python

One of the book's distinguishing features is its emphasis on automation.

Readers learn how to automate repetitive analytical tasks such as:

  • Data collection

  • Report generation

  • File processing

  • Data transformation

  • Scheduled workflows

Automation improves productivity while reducing manual effort and human error.


Scalable Data Workflows

Modern data analysis often involves processing continuously growing datasets.

The book introduces scalable approaches for:

  • Efficient workflows

  • Reusable code

  • Data pipeline organization

  • Workflow optimization

These practices prepare readers for enterprise-level analytics environments.


Real-World Projects

Practical experience is a major strength of the book.

Readers complete projects including:

Sales Analysis

Analyze revenue trends and business performance.

Customer Analytics

Study customer behavior and segmentation.

Financial Data Analysis

Explore investment and transaction datasets.

Business Reporting

Automate analytical reports using Python.

Predictive Analytics

Build forecasting models for decision support.

These projects reinforce both programming and analytical skills.


Business Applications

Python-based data analysis supports numerous industries.

Finance

Risk analysis and investment forecasting.

Healthcare

Patient outcome analysis and clinical research.

Retail

Customer segmentation and demand forecasting.

Marketing

Campaign performance analysis.

Manufacturing

Operational monitoring and quality control.

Education

Student performance analysis and reporting.

These applications demonstrate the versatility of Python across business domains.


Skills You Will Develop

By studying this book, readers strengthen expertise in:

  • Python Programming

  • NumPy

  • Pandas

  • Data Cleaning

  • Exploratory Data Analysis

  • Data Visualization

  • Statistical Analysis

  • Predictive Modeling

  • Machine Learning Preparation

  • Automation

  • Workflow Optimization

  • Scalable Data Processing

  • Business Analytics

  • Reporting

  • Data-Driven Decision Making

These skills are highly valuable for modern analytics and AI careers.


Download the PDF for free: Python for Data Analysis: The Modern Guide to Scalable Data, Advanced Models, and Automation (Data Analytics Toolkit)

Who Should Read This Book?

This book is ideal for:

Beginners

Starting their data analysis journey.

Data Analysts

Improving analytical workflows.

Business Intelligence Professionals

Developing automation skills.

Software Developers

Expanding into data science.

Aspiring Data Scientists

Building strong Python foundations.

Business Professionals

Learning practical analytics for decision-making.

A basic understanding of Python is helpful, but the structured explanations make the material accessible to motivated learners.


Why This Book Stands Out

Several features distinguish this guide from many introductory Python resources:

  • Modern data analysis techniques

  • Scalable workflow focus

  • Automation-driven approach

  • Practical business examples

  • Comprehensive Python coverage

  • Real-world analytical projects

  • Integration with machine learning

  • Industry-relevant skills

  • Strong balance between theory and practice

Rather than teaching Python programming in isolation, the book demonstrates how Python solves real analytical challenges in professional environments.


Career Opportunities After Reading This Book

The knowledge gained from this book supports careers including:

  • Data Analyst

  • Data Scientist

  • Business Intelligence Analyst

  • Python Developer

  • Machine Learning Engineer

  • Analytics Consultant

  • Financial Analyst

  • Data Engineer

  • Operations Analyst

  • AI Engineer

The practical skills developed also prepare readers for advanced learning in machine learning, deep learning, big data analytics, and artificial intelligence.


Kindle: Python for Data Analysis: The Modern Guide to Scalable Data, Advanced Models, and Automation (Data Analytics Toolkit)

Hard Copy: Python for Data Analysis: The Modern Guide to Scalable Data, Advanced Models, and Automation (Data Analytics Toolkit)

Conclusion

Python for Data Analysis: The Modern Guide to Scalable Data, Advanced Models, and Automation provides a comprehensive roadmap for mastering Python-based data analysis in today's data-centric world.

By covering:

  • Python Programming

  • NumPy

  • Pandas

  • Data Cleaning

  • Exploratory Data Analysis

  • Data Visualization

  • Advanced Analytics

  • Predictive Modeling

  • Machine Learning Integration

  • Workflow Automation

  • Scalable Data Processing

  • Real-World Projects

  • Business Analytics

  • Reporting

  • Data-Driven Decision Making

the book equips readers with both the technical knowledge and practical experience needed to analyze data efficiently and build scalable analytical solutions.

For students, data analysts, software developers, business professionals, and aspiring data scientists, this book serves as an excellent guide to modern data analytics. By combining Python programming, advanced analytical techniques, automation strategies, and practical business applications, it prepares readers to solve real-world data challenges and build successful careers in data science, artificial intelligence, and business intelligence.

Tuesday, 21 April 2026

Complete Data Science Training with Python for Data Analysis


In today’s data-driven world, the ability to analyze data and extract insights is one of the most valuable skills you can have. From business decisions to AI systems, everything relies on data analysis powered by Python.

The course Complete Data Science Training with Python for Data Analysis is designed to take you from beginner to job-ready, teaching you how to work with real datasets, perform analysis, and build practical data science skills. ๐Ÿš€


๐Ÿ’ก Why This Course Matters

Data science is not just about coding — it’s about understanding data, finding patterns, and making decisions.

This course helps you:

  • Learn Python specifically for data analysis
  • Work with real-world datasets
  • Build a strong foundation for machine learning

Python is widely used in data science because of its powerful ecosystem, including libraries like NumPy, Pandas, and Matplotlib for data manipulation and visualization


๐Ÿง  What You’ll Learn

This course is designed as a complete data science training program, covering all essential stages of data analysis.


๐Ÿ”น Python Fundamentals for Data Science

You’ll begin with:

  • Variables, loops, and functions
  • Data structures like lists and dictionaries
  • Writing clean and efficient Python code

These fundamentals are essential for working with data.


๐Ÿ”น Data Analysis with Pandas & NumPy

A major focus is on industry-standard tools:

  • NumPy → numerical computations
  • Pandas → data manipulation

These libraries allow you to:

  • Load datasets
  • Clean and transform data
  • Perform statistical analysis

They are considered core tools for any data scientist


๐Ÿ”น Data Cleaning and Preparation

Real-world data is messy — and cleaning it is crucial.

You’ll learn how to:

  • Handle missing values
  • Normalize and format data
  • Prepare datasets for analysis

Data preprocessing is one of the most important steps in any data science workflow.


๐Ÿ”น Data Visualization

You’ll explore visualization tools such as:

  • Matplotlib
  • Seaborn

These tools help you:

  • Create charts and graphs
  • Identify trends and patterns
  • Communicate insights effectively

Visualization is key to turning data into actionable insights.


๐Ÿ”น Introduction to Machine Learning

The course also introduces basic ML concepts:

  • Regression and classification
  • Model training and evaluation
  • Using Scikit-learn

Python-based ML tools allow you to build predictive models and analyze patterns in data


๐Ÿ”น Real-World Projects

A key highlight is hands-on learning:

  • Work with real datasets
  • Build end-to-end data analysis projects
  • Apply skills in practical scenarios

Project-based learning is essential for developing real-world data science skills


๐Ÿ›  Learning Approach

This course follows a practical, hands-on approach:

  • Step-by-step coding tutorials
  • Real-world examples
  • Interactive exercises

This helps you move from theory → practical application → real skills.


๐ŸŽฏ Who Should Take This Course?

This course is ideal for:

  • Beginners in data science
  • Students and freshers
  • Professionals switching careers
  • Anyone interested in data analysis

๐Ÿ‘‰ No prior experience required.


๐Ÿš€ Skills You’ll Gain

By completing this course, you will:

  • Analyze data using Python
  • Use Pandas and NumPy effectively
  • Create visualizations and reports
  • Build basic machine learning models
  • Work on real-world data projects

๐ŸŒŸ Why This Course Stands Out

What makes this course valuable:

  • Complete beginner-to-advanced coverage
  • Focus on real-world data analysis
  • Hands-on projects and exercises
  • Uses industry-standard tools

It helps you move from zero → data analyst → data science ready.


Join Now: Complete Data Science Training with Python for Data Analysis

๐Ÿ“Œ Final Thoughts

Data science is one of the most in-demand skills in the modern world — and Python is the best tool to learn it.

Complete Data Science Training with Python for Data Analysis provides a structured, practical pathway to mastering data analysis. It equips you with the skills needed to work with data, generate insights, and start your journey in data science.

If you’re serious about building a career in data analysis or AI, this course is an excellent starting point. ๐Ÿ“Š๐Ÿ✨

Tuesday, 8 October 2024

Python For Data Analysis: Unlocking The Power Of Data Analysis With Python Programming And Hands-On Projects (complete python programming handbooks)


Are you ready to unlock the power of data analysis and harness Python’s potential to turn raw data into valuable insights? Python Programming for Data Analysis: Unlocking the Power of Data Analysis with Python Programming and Hands-On Projects is your comprehensive guide to mastering data analysis techniques and tools using Python.

Whether you're a beginner eager to dive into the world of data or a professional looking to enhance your skills, this hands-on guide will equip you with everything you need to analyze, visualize, and interpret data like never before.

Why this book is essential for data enthusiasts:

  •  Learn how to use Python programming to handle, clean, and analyze large datasets with ease. From basic techniques to advanced methods, this book covers everything you need to know to excel in data analysis.
  •  Apply your learning with real-world projects that provide a practical understanding of data analysis in action. You'll work through examples in finance, healthcare, marketing, and more to deepen your skills.
  •  Discover the power of Python libraries like Pandas, NumPy, Matplotlib, and Seaborn to transform raw data into meaningful insights. Learn how to manipulate data efficiently, perform statistical analysis, and visualize results beautifully.
  •  Understand how to create stunning visualizations that communicate your findings effectively. Learn best practices for visualizing data in a way that tells compelling stories and drives decisions.
  •  Gain experience in applying Python to solve real-world data challenges, whether it's analyzing sales trends, predicting customer behavior, or optimizing business processes through data-driven insights.
  •  Whether you're just starting out or refining your data skills, this book provides a clear, step-by-step approach to understanding the principles of data analysis and how to apply them in Python.

By the end of Python Programming for Data Analysis, you’ll have the confidence and capability to tackle any data analysis challenge, backed by a solid foundation in Python programming. This is your gateway to becoming a data-driven problem solver in any field.

Unlock the potential of your data—click the "Buy Now" button and start your journey into Python-powered data analysis today.

Hard Copy : Python For Data Analysis: Unlocking The Power Of Data Analysis With Python Programming And Hands-On Projects (complete python programming handbooks)

Thursday, 1 February 2024

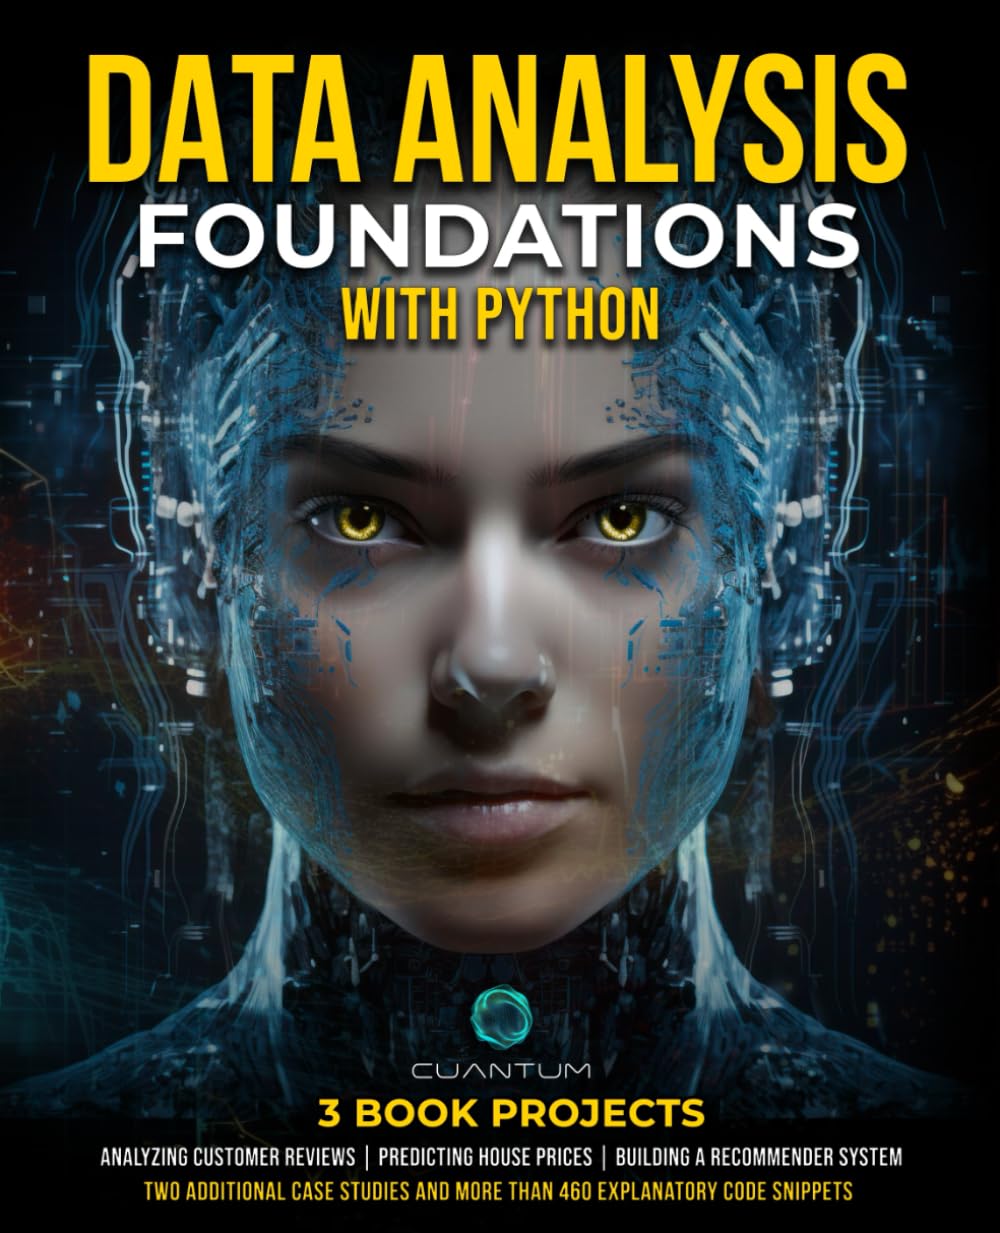
Data Analysis Foundations with Python: Master Python and Data Analysis using NumPy, Pandas, Matplotlib, and Seaborn: A Hands-On Guide with Projects and Case Studies.


Unlock the Full Potential of Data Analysis with Python—All in One Comprehensive Guide!

Are you an aspiring data scientist or analyst with a passion for exploring the vast possibilities of Python-based data analysis? If so, you're in luck because "Data Analysis Foundations with Python" is the perfect guide for you.

This comprehensive and immersive book will not only provide you with a hands-on approach but also offer a detailed exploration of the fascinating world of Python-based data analysis. Whether you're a beginner or an experienced professional, this book will take you on a journey that will deepen your understanding and expand your skills in the field.

✅ Include a Free Repository Code with all code blocks used in this book.

✅ This free resource allows you to copy and paste the book code for easy manipulation.

✅ Free premium customer support.

From Basics to Mastery: A Structured Learning Journey

This book is not just a mere compilation of Python codes and data sets. It goes beyond that, offering a comprehensive course that will guide you from being a Python beginner to becoming a highly skilled Data Analyst.

Throughout this course, you will not only acquire essential Python skills, but also gain practical experience in data manipulation techniques and learn about the latest advancements in machine learning. With its well-structured content and engaging learning activities, this book ensures that your journey towards becoming a proficient Data Analyst is both seamless and enjoyable.

Three Exceptional Projects and Two In-Depth Case Studies

Project 1: Analyzing Customer Reviews: Learn how to extract, clean, and make sense of textual data from online customer reviews.

Project 2: Predicting House Prices: Delve into the fascinating world of supervised learning, where you'll get to apply complex machine learning models to predict property prices.

Project 3: Building a Recommender System: Uncover the secrets of unsupervised learning as you build and deploy a fully functioning recommender system.

Case Studies for Real-world Insight

Case Study 1: Sales Data Analysis: Unearth the power of Python to transform raw sales data into actionable insights.

Case Study 2: Social Media Sentiment Analysis: Venture into the realm of Natural Language Processing and learn how to analyze public sentiment from social media data.

Additional Features

Practical Exercises: Each chapter concludes with practical exercises, designed to test your understanding and apply what you’ve learned in real-world scenarios.

Best Practices and Tips: The final section of the book is devoted to best practices in the field, including code organization and how to continue learning and growing in your data analysis journey.

Who This Book Is For

Whether you're a student who is eager to expand your knowledge, a professional who is seeking to embark on a new career path, or an experienced analyst who is looking to enhance your skills and stay ahead in the industry—this comprehensive book is specifically tailored to meet your needs and provide valuable insights and guidance.

What Are You Waiting For?

Embark on a transformative journey to unlock Python's potential for data analysis. Gain a deep understanding of Python's capabilities and learn how to extract insights from complex datasets using libraries and tools. Develop skills through real-world case studies and hands-on exercises to confidently tackle analytical challenges.

This book equips you with technical knowledge, practical skills, and a growth mindset for continuous learning. Don't miss this opportunity to become a proficient Python data analyst. Get your copy now for unlimited possibilities in data analysis.

Hard Copy: Data Analysis Foundations with Python: Master Python and Data Analysis using NumPy, Pandas, Matplotlib, and Seaborn: A Hands-On Guide with Projects and Case Studies.

Thursday, 5 March 2026

Data Science with Python - Basics


Introduction

Data science has become one of the most important fields in the modern digital world. Organizations rely on data to understand trends, predict outcomes, and make smarter decisions. To work effectively with data, professionals need tools that allow them to analyze, visualize, and interpret information efficiently. One of the most popular tools for this purpose is Python, a versatile programming language widely used in data analysis and machine learning.

The book “Data Science with Python – Basics” by Aditya Raj introduces readers to the fundamental concepts of data science and demonstrates how Python can be used to perform data analysis and build useful insights from datasets. The book is designed as a beginner-friendly guide that explains the essential skills required to start a career or learning journey in data science. It contains around 186 pages and focuses on practical understanding rather than complex theory.


Understanding Data Science

Data science is the process of extracting meaningful insights from data using analytical techniques, programming, and statistical methods. It combines several disciplines, including mathematics, computer science, and domain knowledge.

The book explains how data scientists work with data throughout the entire pipeline. This process generally includes:

  • Collecting data from different sources

  • Cleaning and preparing the data

  • Analyzing patterns and relationships

  • Building predictive models

  • Communicating results through visualizations

Understanding these steps helps beginners see how raw information can be transformed into valuable insights.


Why Python is Important for Data Science

Python has become one of the most widely used programming languages in the data science community. Its simple syntax and powerful libraries make it accessible to beginners while still being capable of handling complex analytical tasks. Python supports multiple programming styles and includes built-in data structures that help developers build applications quickly.

In the book, Python is used to demonstrate how data analysis tasks can be performed efficiently. Learners are introduced to common Python tools and libraries that are widely used in the industry. These tools allow users to manipulate data, perform calculations, and visualize results.


Core Topics Covered in the Book

The book focuses on building a strong foundation in data science using Python. Some of the major topics typically covered include:

Python Programming Fundamentals

Readers first learn the basics of Python programming, including variables, data types, loops, and functions. These concepts are essential for writing scripts that process and analyze data.

Data Manipulation and Analysis

Data scientists often work with large datasets. The book introduces methods for reading, cleaning, and transforming data so that it can be analyzed effectively.

Data Visualization

Visual representation of data helps people understand patterns and trends quickly. Learners explore techniques for creating charts and graphs that make complex information easier to interpret.

Introduction to Machine Learning Concepts

Although the book focuses on fundamentals, it also introduces the idea of machine learning—where algorithms learn patterns from data and make predictions.

These topics give readers a broad understanding of how data science workflows operate in real-world scenarios.


Skills Readers Can Develop

After studying this book, readers can develop several valuable skills, including:

  • Understanding the basic workflow of data science projects

  • Writing Python code for data analysis tasks

  • Cleaning and preparing datasets for analysis

  • Visualizing data to uncover patterns and insights

  • Building a foundation for learning machine learning and advanced analytics

These skills form the starting point for anyone interested in becoming a data analyst or data scientist.


Who Should Read This Book

“Data Science with Python – Basics” is particularly suitable for:

  • Students who want to start learning data science

  • Beginners with little or no programming experience

  • Professionals interested in switching to a data-driven career

  • Anyone curious about how Python is used in data analysis

Because the book focuses on fundamental concepts, it serves as a stepping stone toward more advanced topics in machine learning and artificial intelligence.

Hard Copy: Data Science with Python - Basics

Kindle: Data Science with Python - Basics

Conclusion

“Data Science with Python – Basics” provides a clear and accessible introduction to the world of data science. By combining simple explanations with practical examples, the book helps beginners understand how data can be analyzed and interpreted using Python.

For anyone starting their journey in data science, learning Python and understanding the basic workflow of data analysis are essential first steps. This book offers a solid foundation for developing those skills and prepares readers for deeper exploration of machine learning, data analytics, and artificial intelligence in the future.

Popular Posts

Categories

100 Python Programs for Beginner (119) AI (329) Android (25) AngularJS (1) Api (7) Assembly Language (2) aws (31) Azure (12) BI (10) Books (319) Bootcamp (14) C (78) C# (12) C++ (83) cloud (1) Course (87) Coursera (302) Cybersecurity (34) data (10) Data Analysis (44) Data Analytics (31) data management (16) Data Science (414) Data Strucures (18) Deep Learning (212) Django (16) Downloads (3) edx (21) Engineering (15) Euron (30) Events (7) Excel (24) Finance (13) flask (4) flutter (1) FPL (17) Generative AI (77) Git (12) Google (54) Hadoop (3) HTML Quiz (1) HTML&CSS (48) IBM (43) IoT (3) IS (25) Java (99) Leet Code (4) Machine Learning (373) Meta (24) MICHIGAN (5) microsoft (13) Nvidia (8) Pandas (16) PHP (20) Projects (34) Python (1354) Python Coding Challenge (1208) Python Mathematics (8) Python Mistakes (51) Python Quiz (590) Python Tips (98) Questions (3) R (72) React (7) Scripting (3) security (4) Selenium Webdriver (4) Software (21) SQL (54) Udemy (18) UX Research (1) web application (11) Web development (9) web scraping (3)

Followers

Python Coding for Kids ( Free Demo for Everyone)