
Bivariate Plot :
Provide first hand visual information about the nature and degree of relationship between two variables.
Relationship can be linear or nonlinear.
We discuss several types of plots through example.

Scatter Plot :
plot command:
x, y : Two data vectors
plot (x,y)
plot (x, y, type)

Get more details from help: help ("type")
Other options:
main an overall title for the plot.
suba sub title for the plot.
xlaba title for the x axis.
ylaba title for the y axis.
aspthe y/x aspect ratio.
Example :
Daily water demand in a city depends upon weather temperature.
We know from experience that water consumption increase as weather temperature increase.
Date on 27 days is collected as follows:
Daily water demand (in million liters)
water <- c (33710, 31666, 33495, 32758, 34067, 36069, 37497, 33044, 35216, 35383, 37066, 38037, 38495, 39895, 41311, 42849, 43038, 43873, 43923, 45078, 46935, 47951, 46085, 48003, 45050, 42924, 46061)
Temperature (in centigrade)
temp <- c (23,25,25,26,27,28,30,26,29,32,33,34,35,38,39,42,43,44,45,45,.5,
45, 46,44,44,41,37,40)
Plot command:

x, y : Two data vectors
Various type of plot are possible to draw.
plot (x, y)
plot (water, temp)

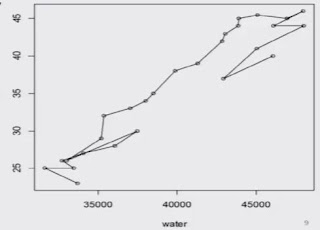
plot (water, temp, "1")
"1" for lines,
plot (water, temp, "0")
"0" for both 'overplotted'

plot (water, temp, "h")
"h" for 'histogram' like
(or 'high-density')
vertical lines

plot (water, temp, "s")
"s" for stair steps.


Smooth Scatter plot


Provide first hand visual information about the nature and degree of relationship between two variables.
Relationship can be linear or nonlinear.
We discuss several types of plots through example.

Scatter Plot :
plot command:
x, y : Two data vectors
plot (x,y)
plot (x, y, type)
Get more details from help: help ("type")
Other options:
main an overall title for the plot.
suba sub title for the plot.
xlaba title for the x axis.
ylaba title for the y axis.
aspthe y/x aspect ratio.
Example :
Daily water demand in a city depends upon weather temperature.
We know from experience that water consumption increase as weather temperature increase.
Date on 27 days is collected as follows:
Daily water demand (in million liters)
water <- c (33710, 31666, 33495, 32758, 34067, 36069, 37497, 33044, 35216, 35383, 37066, 38037, 38495, 39895, 41311, 42849, 43038, 43873, 43923, 45078, 46935, 47951, 46085, 48003, 45050, 42924, 46061)
Temperature (in centigrade)
temp <- c (23,25,25,26,27,28,30,26,29,32,33,34,35,38,39,42,43,44,45,45,.5,
45, 46,44,44,41,37,40)
Plot command:

x, y : Two data vectors
Various type of plot are possible to draw.
plot (x, y)
plot (water, temp)

plot (water, temp, "1")
"1" for lines,

plot (water, temp, "0")
"0" for both 'overplotted'

plot (water, temp, "h")
"h" for 'histogram' like
(or 'high-density')
vertical lines

plot (water, temp, "s")
"s" for stair steps.


scatter.smooth (x, y) provides scatter plot with smooth curve
Example: scatter.smooth (water, temp)
Matrix Scatter plot
The command pairs ( ) allows the simple creation of a matrix of scatter plots.
> pairs ( cbind (water, temp) )

3 Dimensional Scatter Plot:
Scatterplot3d ( ) Plots a three dimensional (3D) point cloud
> install.packages ("sccatterplot3d")
> library (scatterplot3d)
> setwd ("c: /RCourse/")
> data3d <- read.csv ("data-age-height-weight.csv")
> data3d

> scatterplot3d (data3d [, 1: 3])

More functions
- contour ( ) for contour lines
- dotchart ( ) for dot charts (replacement for bar charts)
- image ( ) pictures with colors as third dimension
- mosaicplot ( ) mosaic plot for (multidimensional) diagrams of of categorical variables (contingency tables)
- persp ( ) perspective surfaces over the x-y plane


.png)


0 Comments:
Post a Comment